|
||||||||||||||||
Welcome!
|
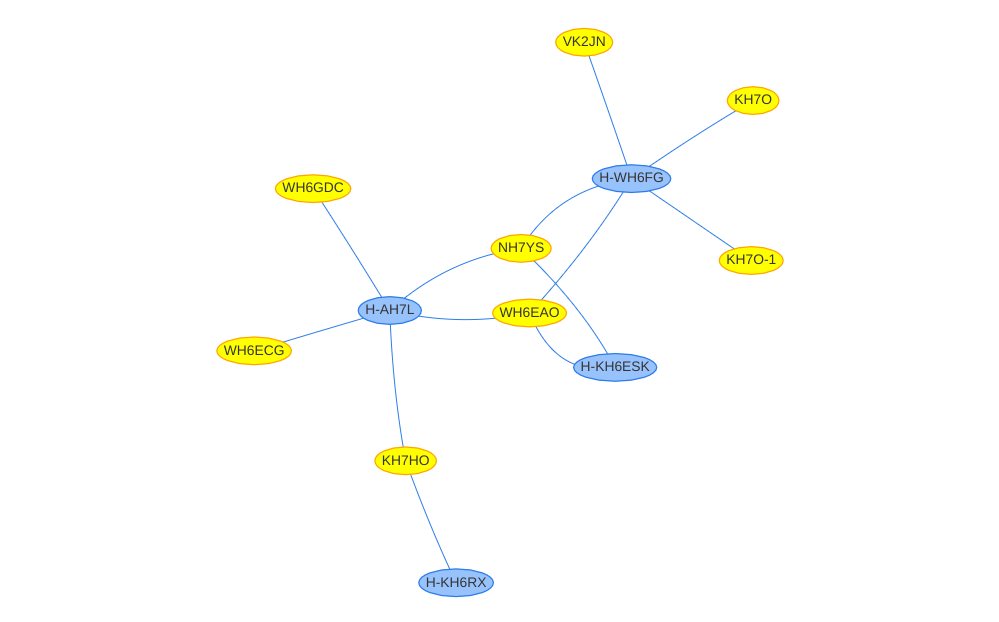
Have you ever wondered how interconnected the Hawaii Winlink VARA gateways are? This is the right place to find out more! Log files are automatically collected for many Hawaii Winlink Gateways, and sent to a center server where we have generated network graphs. To the right of this text is an example network graph, for some of the HF gateways in Hawaii - The blue ovals represent the gateways, the yellow ovals represent the stations, and the lines between gatways and stations show which gateways had connections with which stations. Please come visit this page again! We've just started creating the network graphs, and will be adding to this very soon (more network graphs, different time ranges, metrics on gateways, etc). |

|
VARA Log collection
Many of the Hawaii gateways are configured to send their VARA log messages to a central server using syslog. Every few minutes, a static page is generated to show the log entries (VARA syslog button above). Logs are archived on the server, but only the current day is visible on the website.
Turning VARA Logs in Network Graphs
Once every 10 minutes, the VARA logs are parsed into (currently) 3 different network graphs, which are accessible using the buttons above. These network graphs do not show geographically where the stations and gateways are - they do show the gateways and the stations. Lines between stations and gateways indicate either if a gateway heard a station or if a gateway connected to a station.
This is done using a series of scripts written in bash, awk, sed and perl. Once we have the list of gateways and stations, and the connetions between them, the network graphs are generated using vis-network.js
How do I get my gateway in here?
These network graphs and metrics are only inteded for Hawaii Gateways - if you are a Hawaii gateway and would like to be included, please contact AH7RF (callsign @ arrl.net) - here are the requirements:
- Hawaii Gateway
- Registered copy of VARA
- A version of VARA that supports syslog
How do I set this up in my area?
Good question! I am working on a set of instructions which I hope to put on github.com. Until then - feel free to email AH7RF.